Publishers experiment with interactive content
A couple weeks ago I read that the solution to “listicles” is quizzes. So instead of a top ten list of something, the author thought brands and publishers should be developing quizzes. Author Anna Talerico noted that content doubles in volume every 9 to 24 months, so with more competition, content-makers need to diversify the type of content they’re publishing. I mean, Talerico is Co-Founder of ion interactive, so you could say she has some skin in the interactive content game.
She’s not in a war with list posts, though, just noting that we need to start thinking bigger. I tend to agree, even if I don’t think quizzes are the end-all solution (and I don’t think she does, either.)
She writes, “a recent study by Lumanu found that out of 1,500 travel articles by top publishers like Thrillist and Lonely Planet, nearly one-third of content was in listicle form, which means marketers who rely on lists to educate consumers are going to be up against a lot of similar content.” According to the study, listicles get 10% more engagement in social, but she notes that “a study from BuzzSumo and Moz analyzed over a million pieces of content to see, once and for all, if social media engagement translated to content success,” and the results showed that listicles that performed well in social didn’t necessarily get additional inbound links or perform well in search.
[text_ad]
Now, keep in mind the types of listicle posts you see on Facebook. Everything from the “10 best tweets from the Kardashians” to the “54 best cat videos on the internet.” When we’re looking at the cesspool of the Internet, and we now know weak clickbait content like this is doubling every 9 to 24 months, it’s easy to see how listicle posts don’t perform well on average. There are a lot of bad lists out there. But we happen to know a lot of lists produced by publishers producing high-quality content doing swell.
Getting back to diversifying content and interactive content, I love Bustle’s approach to creating custom illustrations for interactive content and for their social channels. According to Digiday, “The idea behind the illustrations is to tell stories in a unique way. While many publishers are pouring resources into video creation, Bustle is making something of a contrarian bet on original drawings, employing a dozen illustrators to create whimsical infographics, memes and cartoons.”
“Our designers and editors are millennial women, we are our audience. If it resonates with us, chances are our audience will enjoy it,” added Hayley Saltzman, deputy editor of social media.
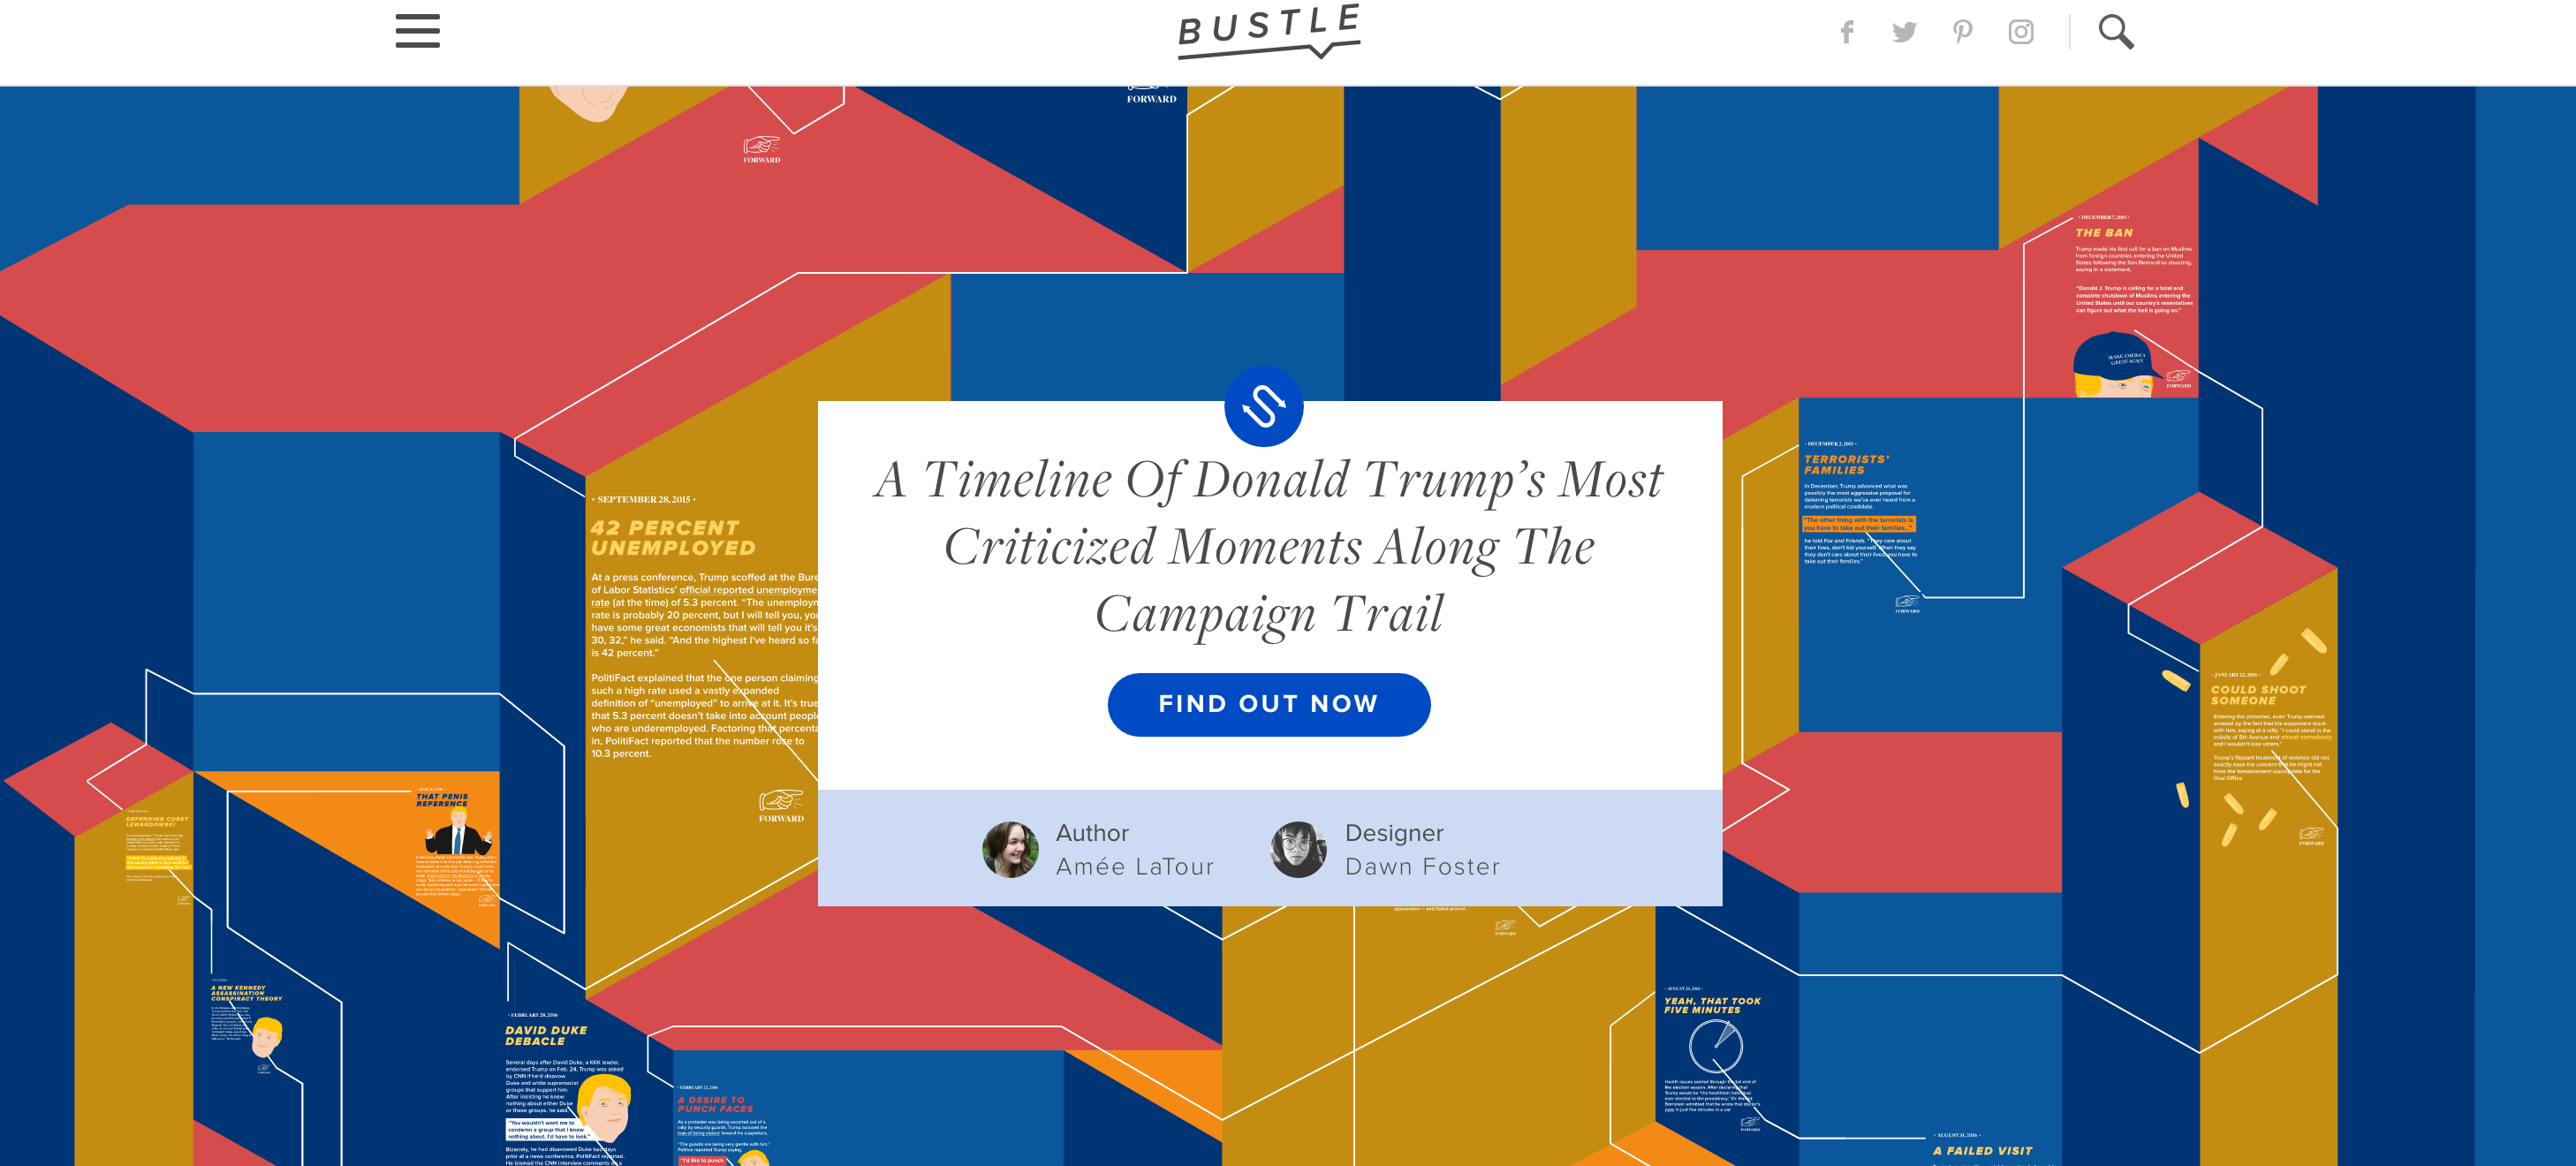
But they’re not just using custom illustrations for social, they’re integrating them into their site too, much like The Verge pioneered several years ago. In this example, they have an article flowchart that features A Timeline of Donald Trump’s Most Criticized Moments Along the Campaign Trail. The graphic quite literally takes you visually from the beginning to the end. There are other flowcharts too, like Which Emoji Best Represents Your Political Learnings? that speaks to the type of interactivity Talerico is calling for (even if this implementation is a little clunky in style.)
Digiday reports, “A recent illustration that compares the feeling to the reality of pulling yourself up off the couch to brush your teeth got 29,600 likes. Another post, “Stages of my paycheck,” which begins with a drawing of a “fancy latte” then a large coffee to a small tea, then finally hot water, also resonated with a large chunk of Bustle’s 763,000 followers and the comments were sprinkled with the laughing-tears-in-the-eyes emoji throughout.”
It’s fun to watch publishers experiment with content, even when we cringe at the lack of SEO available in certain interactive content formats. Do you have thoughts / opinions?