
For digital publishing analytics to be useful, they must set the stage and provide the publisher with information on what to do with the data. On the surface, most analytics don’t provide action items; you need to know how to use them.
At Mequoda, we value four types of digital magazine analytics, which we use to monitor, measure, and improve the digital magazine publishing systems we work on. Below, we’ll review how four types of analytics: descriptive, diagnostic, predictive, and prescriptive analytics, should be used to support your system.
[text_ad]
Descriptive Analytics
We begin with descriptive analytics. At Mequoda, we use descriptive analytics to produce monthly report packages for our clients that chronicle how our key metrics are doing over time. It allows us to form foundational baselines for how the systems are operating and how certain key metric drivers are improving or flatlining. When most people think of analytics, this is usually where they start and stop.
The Google Visibility Index (GVI) is one of these reports. The GVI is a key metric that allows us to know how successful we are at gaining market share around search engine traffic and arrivals. It is an upstream metric that has a causal relationship to the downstream metrics associated with how much traffic is coming in from the various search engines, especially Google.
Below is an example from one of our clients, The Program on Negotiation at Harvard Law School, showing how their GVI has improved, meaning that they are being seen in Google for more of the keywords they want to rank for.
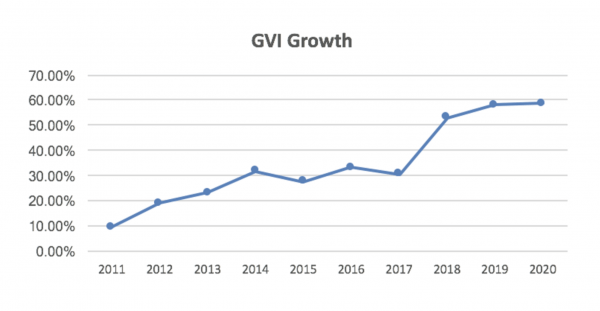
A big reason why their GVI has improved is because they started managing their blockbuster post list. Meaning, we identified their top-performing posts that drive the most traffic to the website. They began recycling them, which we’ll talk more about next because it falls under the second category of digital publishing analytics: diagnostic analytics.
Diagnostic Analytics
A perfect example of diagnostic analytics would be investigating a blockbuster post (mentioned above) that has traditionally driven a ton of traffic but has stopped. Thus, you have started losing thousands, maybe tens of thousands of visitors every month.
Diagnostic analytics could be when we dig in to find out why traffic is dropping, then find that post causing the harm. For us, this is when we update that post to get traffic back.
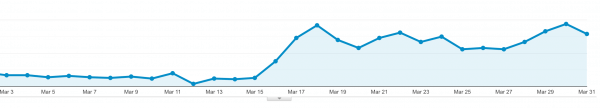
Below is a great example from Cabot Wealth Network. Highest-Paying Dividend Stocks in the S&P 500 was a blockbuster post as far back as March 2019. It had formerly been a top-10 performing post (#8). When we were looking into a drop in search traffic in March 2021, we saw that this post had fallen out of the top 10 to position 15, dropping from page 1 in Google to page 2, which makes a huge difference in how many people see the post.

However, on 3/12/21, this post got updated. Four days after the update, traffic increased dramatically, and a month later, the post reached position #5, even higher than it was originally, and resumed sending traffic to the site.
Predictive Analytics
The way we model our Google Visibility Index (mentioned above) is a great example of predictive analytics. We use an Online Market Audit (OMA) to discover the potential for a new website to reach a greater level of visibility at some point in the future.
Before we launched Food Gardening Network, we used an OMA to identify the top ten websites in the “growing/planting vegetables, fruits, and herbs” space.

We identified analytics for the top ten websites and found FineGardening.com, for example, had a GVI of 3.07%, while Almanac.com was the highest at 37.34%.
We used this data to predict what we might expect for FGN’s initial business plan and decided on a target of 4% by year five. So the descriptive analytics from other systems can be used to inform the predictive analytics that goes into modeling the future of any key metric.
Prescriptive Analytics
Finally, at the highest level, prescriptive analytics ties together data from multiple systems. Staying in the same lane, let’s talk about GVI again here. In the example below, we compare the frequency with which five different digital magazine publishing systems are publishing per week.
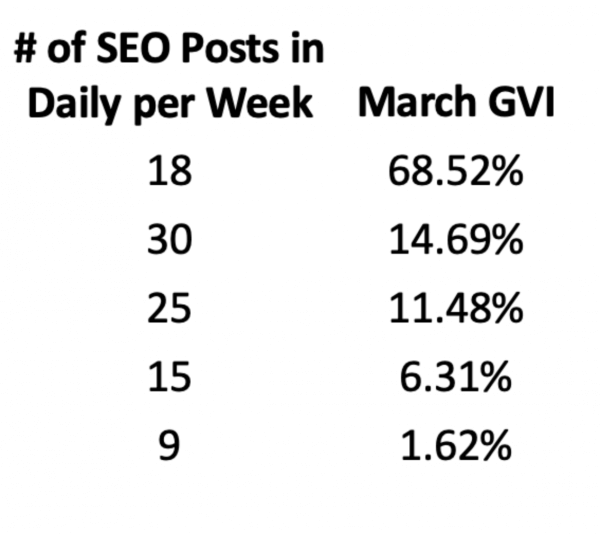
The data shows that the weekly post frequency is clearly correlated to the GVI. So the prescriptive recommendation is that a website increases its post frequency to drive an increase in its Google Visibility.
Digital publishing systems, including our own, have seen clear drops when they reduce their publishing frequency. Historically, we can almost always demonstrate that the drop in post frequency is correlated to a drop in GVI and arrivals from Google.
This last example of prescriptive analytics is how we create, evolve, and update our digital magazine publishing system business processes and best practices. It is the most valuable, high-impact form of analytics we have at our disposal. It is, of course, highly dependent upon its three cousins: descriptive analytics, diagnostic analytics, and predictive analytics.
How can you apply these digital publishing analytics to your business? What questions do you have? I’m happy to answer them in the comments below or over the phone. Schedule a call with me to talk about it.